Graphical data processing using GNUPLOT
For more information about working with Gnuplot in this brief tutorial in Czech.
Before processing, we already know and have:
- A defined problem and theoretical assumptions, e.g. Popeye shoots a slingshot high on the Earth's surface. Theory: Newtonian mechanics, uniformly accelerated motion described by the quadratic relation above ($s_2 = g/2 = 4.90\,\mathrm{m\cdot s^{-2}}$); theory of elasticity. Assumptions: ideal spring with no energy dissipation. (i.e. the law of conservation of energy applies $1/2 mA^2 = 1/2 kR^2$.) Neglect air resistance, earth rotation. Problem: Determine the velocity of the projectile $A$ immediately after firing and calculate the rubber stiffness of the slingshot $k$.
- A sufficient number of experimental points in a sufficiently large interval, e.g. ten heights $s(t)$ of the projectile above the ground at a given time (measured in the same way).
- We have figured out the theoretical basis to allow us to use the fitting of the model function. That is, we want to fit the ten values of $s(t)$ with a model function in accordance with theory and assumptions
$$ s(t) = -\frac{g}{2} t^2 + \sqrt{\frac{kR^2}{m}} t + s_0 = -4.90 t^2 + At + s_0,, $$
where we want to determine the parameters $A$ and $s_0$ by fitting with the fit error! We don't need to know the initial position, but we need to include it in the model function to fit the correct $A$ result (similarly, sometimes we need to include the background). By comparing the sides of the equations, it is then easy to express and calculate the desired rubber stiffness $k$ if we know the mass of the projectile $m$ and the maximum stretch of the rubber from the equilibrium position $R$, i.e. $k = A^2 m/R^2$. Remember that the result of the fit $A$ must be written with the correct unit, e.g. if we measure position in meters and time in seconds, then $[A] = \mathrm{m\cdot s^{-1}}$ and $[k] = \mathrm{kg\cdot s^{-2}} = \mathrm{N\cdot m^{-1}}$.
When using the GNUPLOT program for processing, we need to save the measured values in a file named e.g. mereni1.txt and with a fixed structure, e.g.
# measurement no., time [s], height [m], measurement error [m]
# ... legend and comment after the # gnuplot ignores
# numeric values can be separated by any number of spaces or tabs,
# a comma as a decimal separator is not allowed
1 1 17 1
2 2 21 1
3 3 17 1
4 4 3 0.5
After running gnuplot, apply at least the following commands:
cd 'C:/PHYSICS/FYKOS/SERIE3/EXP's(x)=-9.81/2*x**2 + A*x + s0fit s(x) 'mereni1.txt' using 2:3 via A,s0plot s(x), 'mereni1.txt' using 2:3plot [0:5] [0:25] s(x), 'mereni1.txt' using 2:3:($3-$4):($3+$4) with yerrorbars
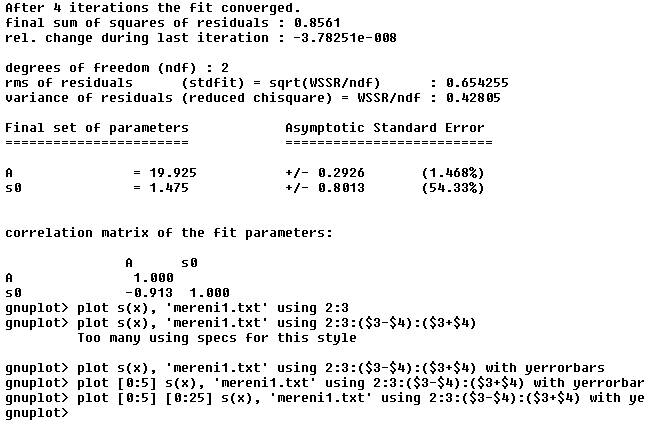
The first command sets the working directory where to look for the file with the measured values mereni1.txt. The second command defines a suitable model dependency, which we then use to fit the measured values, with the independent variable $x$ to be read from the second column and the dependent variable $s(x)$ from the third column. The last commands display the optimal theoretical dependence and the measured values in a common graph, where we can immediately evaluate the correctness of the fit, or repeat the same fit command (sometimes this further refines the A and s0 parameters), etc.
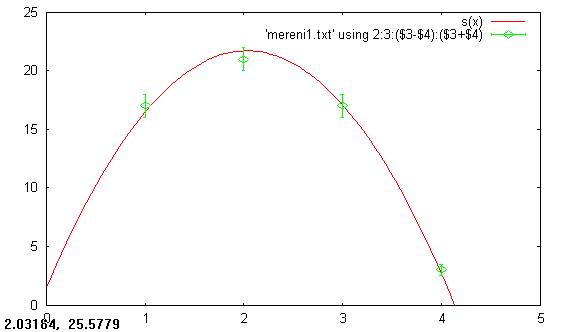
The screen (the gnuplot terminal) has just displayed the last values of the search parameters, including the fit error. For the found value $A = (20.0\pm 0.3)\,\mathrm{m/s}$ in our example, we calculate the stiffness $k$ we are asking for here. Next we see that Popeye held the slingshot about $(1.5\pm 0.8)\,\mathrm{m}$ above the ground and we needed more trials to see a nice graph (but no labels here).
For more useful information, setting up graph labels, showing measurement errors, and exporting graphs, see breef tutorial in Czech with more examples and commands. Try working in gnuplot at your leisure! Please note that upper and lower case letters are not interchangeable in gnuplot!
Automating measurement processing with gnuplot
Imagine that within a project you have to repeat and process a certain measurement several times, each time with a unique result. (For example, Popeye wants to take measurements several times a year to see how the rubber in his sling is weakening.) So you store each projectile flight, i.e. the measured dependency s(t), separately, preferably in a file with the same name, but in different directories, where you can easily copy the batch file containing the command
c:\gnuplot\bin\wgnuplot.exe c:\MUJ_PRAK\work.gp
at the same time with the correct path to the gnuplot module and to your script named process.gp. This will contain a series of appropriate commands as above, or other direct calculations that result in finding the values (parameters) you are looking for. If you would manually enter the same sequence of commands in the gnuplot terminal (if the parameters and file names can remain the same), you can simplify your work by typing the sequence only once in the script and then running it sequentially through gnuplot – the result will be the same. Useful commands are summarized in the breef tutorial in Czech; successful use of the scripts requires programming skill, ingenuity, and, initially, patience in trying. The reward is interesting efficient use of the computer to simplify work. Campers will be given the opportunity to try out automated processing in an afternoon of experimentation. For readers of this introduction, we have prepared a small example in Czech (with a different problem) for inspiration – download and unzip the file, run both *.bat files to create additional files in the directory, and study all the files, especially their structure and function within the whole. You can then try typing the commands from the scripts manually into the gnuplot terminal, which you run with the wgnuplot.exe program (the help command does not work on its own, however).
If you are extremely interested in using gnuplot and have not been able to solve a problem after much effort or self-study, the FYKOS consultants will try to advise you – then send them all your files, scripts, batch files, data, etc. and specify your dream goal sufficiently. For this purpose, the organizers are automatically fully available to the participants at the camp (during the experimental afternoon).